Table of Contents
A website can look fast and still fail Core Web Vitals. It can also score well in a one-time performance test while real visitors continue to experience slow loading, delayed interactions, or unexpected layout shifts.
The solution is not to install random optimization plugins or chase a perfect performance score. You need to identify which Core Web Vital is failing, find the underlying cause, apply a metric-specific fix, and validate the improvement with both diagnostic testing and real-user data.
Quick Answer: How Do You Improve Core Web Vitals?
To improve Core Web Vitals:
- Measure your current LCP, INP, and CLS.
- Separate real-user field data from controlled lab-test results.
- Identify the specific metric that is failing.
- Find the element, interaction, or layout behavior responsible.
- Fix the root cause instead of applying unrelated speed optimizations.
- Retest the affected page in diagnostic tools.
- Monitor field data to determine whether real visitors experience the improvement.
A useful troubleshooting rule is:
Measure → Identify the failing metric → Find the root cause → Fix → Retest → Validate with real users.
This approach is more reliable than treating every Core Web Vitals problem as a generic “website speed” issue.
What Are Core Web Vitals?
Core Web Vitals are user-experience metrics designed to measure important aspects of how a webpage performs for real visitors.
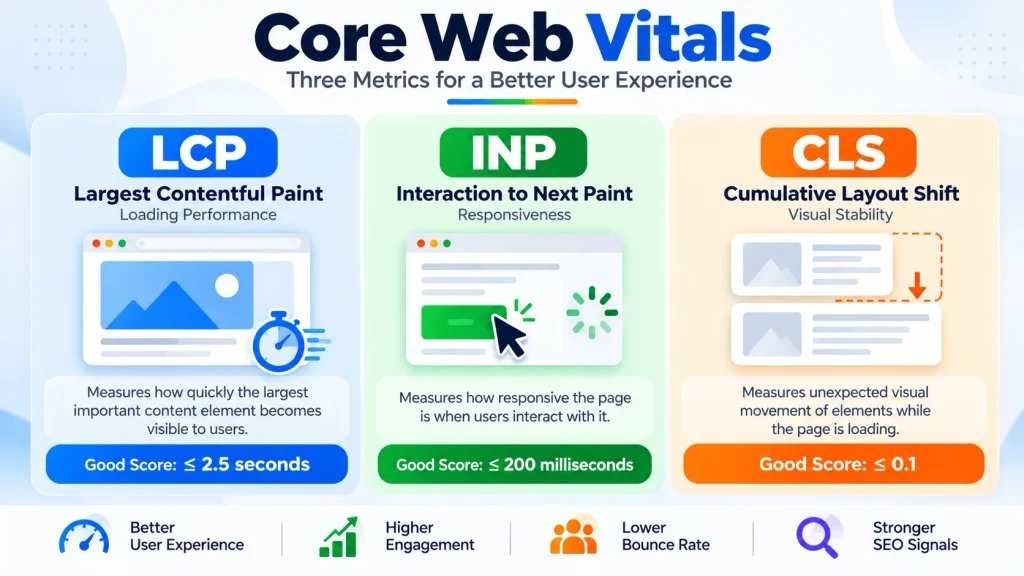
The three current Core Web Vitals are:
| Metric | Measures | Good experience |
|---|---|---|
| LCP | Loading performance | 2.5 seconds or less |
| INP | Interaction responsiveness | 200 milliseconds or less |
| CLS | Visual stability | 0.1 or less |
These thresholds should generally be evaluated at the 75th percentile of page loads, rather than treating a single test run as representative of every visitor.
Each metric describes a different problem.
Largest Contentful Paint (LCP) asks:
How quickly does the main visible content appear?
Interaction to Next Paint (INP) asks:
How responsive does the page feel when a visitor interacts with it?
Cumulative Layout Shift (CLS) asks:
Does visible content unexpectedly move while the page is being used?
This distinction matters because improving one metric does not automatically fix the others.
A compressed image might substantially improve LCP while doing almost nothing for an INP problem caused by excessive JavaScript.
Similarly, faster hosting will not necessarily fix CLS caused by images without dimensions or dynamically inserted content.
Core Web Vitals Are Not the Same as a PageSpeed Score
One of the most common performance mistakes is treating a PageSpeed or Lighthouse score as if it were the same thing as Core Web Vitals.
It is not.
A performance score is a diagnostic result generated under particular test conditions. Core Web Vitals can also be evaluated using real-user field data collected from actual browsing experiences.
That creates situations where:
- Lighthouse looks excellent, but field data still fails.
- A lab test reports poor performance while real-user data remains acceptable.
- Desktop performance looks strong while mobile users struggle.
- One URL performs well while the broader origin has problems.
The correct question is therefore not:
“What is my PageSpeed score?”
It is:
“Which metric is failing for which users, on which pages, and why?”
That question leads to useful diagnosis.
Field Data vs Lab Data: Know Which One You Are Reading
Understanding the difference between field data and lab data is essential before making optimization decisions.
Field Data
Field data represents actual user experiences collected under real-world conditions.
Real visitors may have:
- different devices;
- different processors;
- different network speeds;
- different browsers;
- different geographic locations;
- different cache states;
- different interaction patterns.
This makes field data valuable for understanding what users genuinely experience.
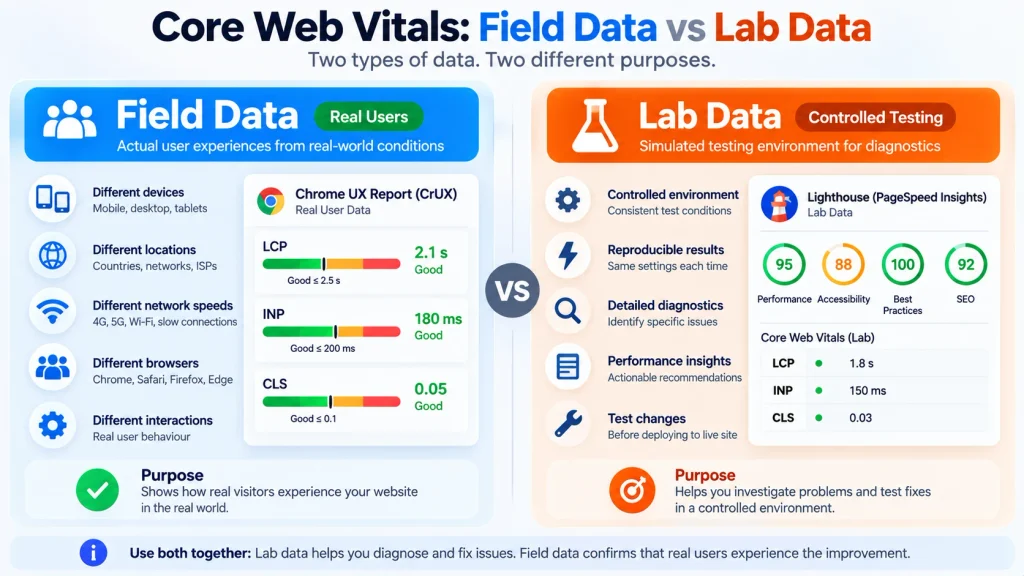
Lab Data
Lab data is produced in a controlled testing environment.
It is extremely useful for:
- reproducing performance problems;
- diagnosing individual resources;
- testing changes before deployment;
- identifying render-blocking resources;
- inspecting loading sequences;
- analyzing main-thread activity.
But a lab test is not every user’s experience.
Why Can Field and Lab Results Disagree?
Suppose your laptop has:
- fast broadband;
- a modern CPU;
- a warm browser cache;
- a nearby CDN edge;
- few browser extensions.
Your page may feel excellent.
A visitor using an entry-level mobile device over a slower connection may experience something very different.
That is why performance optimization should use lab tools for diagnosis and field data for real-world validation.
How to Check Your Core Web Vitals
Before changing anything, establish a baseline.
A practical measurement process is:
Step 1: Check Real-User Data
Determine whether field data exists for the page or origin.
Record:
- LCP;
- INP;
- CLS;
- mobile versus desktop behavior;
- affected URLs or templates.
Do not immediately start optimizing everything.
First identify the failing metric.
Step 2: Run Diagnostic Tests
Use diagnostic tools to investigate why the metric is poor.
Look for:
- the actual LCP element;
- render-blocking resources;
- server response delays;
- long JavaScript tasks;
- slow interactions;
- layout-shifting elements;
- unoptimized images;
- font-loading behavior.
Step 3: Test Representative Pages
Testing only your homepage can hide template-specific problems.
Consider testing:
- homepage;
- article;
- service page;
- category/archive page;
- landing page;
- product page if applicable.
A performance problem caused by an article’s featured-image template may not appear on your homepage.
Step 4: Record Before-and-After Evidence
Keep a simple optimization log:
| Check | Before | Change | After | Field validation |
|---|---|---|---|---|
| LCP | Baseline | Hero image optimized | Retest | Monitor |
| INP | Baseline | Long task reduced | Retest | Monitor |
| CLS | Baseline | Image space reserved | Retest | Monitor |
This prevents optimization from becoming guesswork.
How to Improve Core Web Vitals
The most efficient way to improve Core Web Vitals is to treat LCP, INP, and CLS as separate diagnostic problems.
Do not start with a list of 30 speed tricks.
Start with the failing metric.
How to Improve LCP
Largest Contentful Paint measures how quickly the largest important content element in the initial viewport becomes visible.
Depending on the page, the LCP element might be:
- a hero image;
- a large heading;
- a banner;
- a featured image;
- a text block;
- another prominent content element.
Why Is LCP High?
Poor LCP can result from several layers of the loading process.
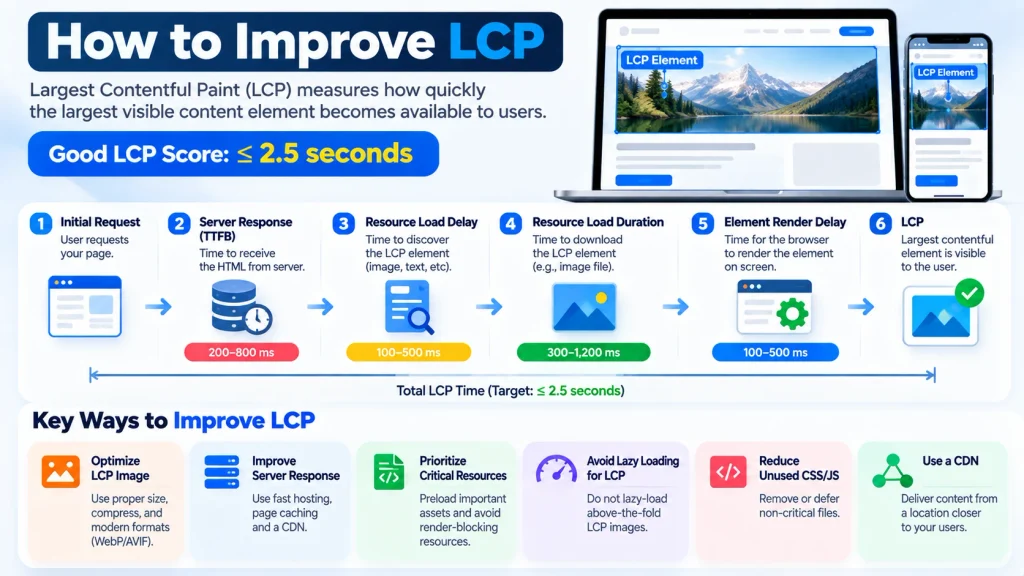
A useful diagnostic model is:
Server → HTML → Resource discovery → Resource download → Rendering → LCP
If the process is slow near the beginning, optimizing the final image alone may not solve the whole problem.
1. Identify the Actual LCP Element
Do not assume the hero image is responsible.
Find the element being measured as LCP.
Once identified, ask:
- Is it an image?
- Is it text?
- When is the browser discovering it?
- Is another resource blocking it?
- Is the server responding slowly?
- Is JavaScript required before it can render?
Optimization becomes much easier once you know what you are actually fixing.
2. Optimize the LCP Image
If the LCP element is an image:
- resize it appropriately;
- compress it without destroying visual quality;
- use an efficient image format where appropriate;
- deliver responsive image sizes;
- avoid downloading unnecessarily large desktop images on small screens.
An image displayed at roughly 800 pixels wide generally does not need to arrive as a massive multi-thousand-pixel source unless a specific use case requires it.
3. Do Not Accidentally Lazy-Load Critical LCP Content
Lazy loading is useful for images below the fold.
But delaying an important above-the-fold LCP image can work against loading performance.
The browser should discover critical content early.
4. Improve Server Response
A slow origin can delay everything that follows.
Investigate:
- hosting performance;
- application processing;
- database work;
- page caching;
- network latency;
- redirects;
- uncached dynamic pages.
A CDN can reduce delivery distance for cacheable resources, but it does not magically repair inefficient application logic.
5. Reduce Render-Blocking Work
Critical content may be ready but unable to appear because CSS, fonts, scripts, or rendering dependencies delay it.
Review what must load before the main content becomes visible.
The goal is not to remove all CSS or JavaScript.
The goal is to prioritize resources required for the initial experience and delay noncritical work where appropriate.
LCP Diagnostic Framework
| Check | What failure looks like | Likely owner | Typical direction |
|---|---|---|---|
| Server response | HTML begins late | Hosting/backend | Caching/server optimization |
| LCP discovery | Critical resource discovered late | Frontend | Prioritize resource |
| Image transfer | Large download | Content/frontend | Resize/compress |
| Render blocking | Element downloaded but appears late | Frontend | Reduce blocking work |
| Client rendering | Heavy processing delays paint | Development | Reduce main-thread work |
The important point is that LCP is a loading pipeline problem, not merely an image-compression problem.
How to Improve INP
Interaction to Next Paint measures how responsive a page is when users interact with it.
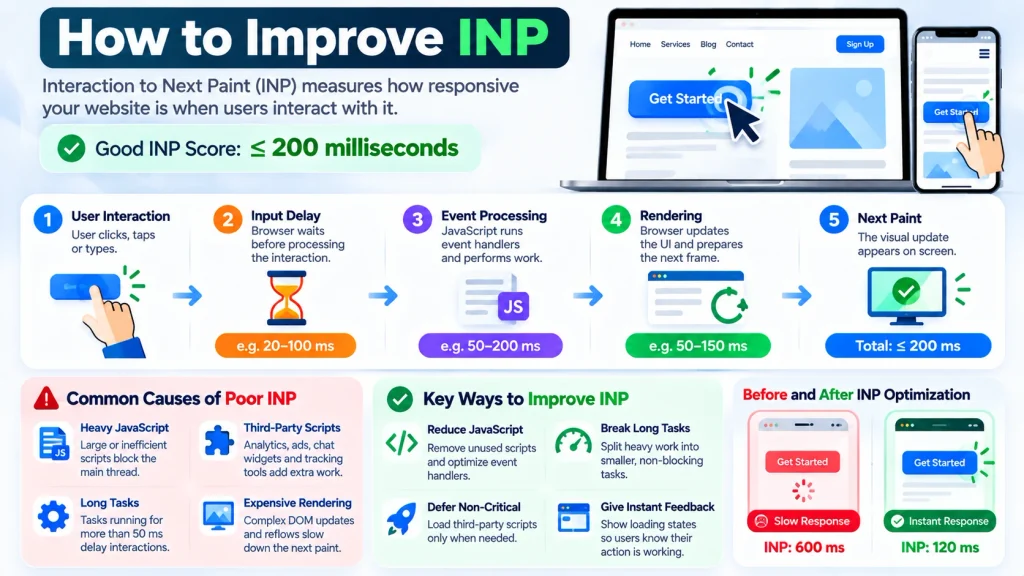
Relevant interactions can include:
- clicking a button;
- opening navigation;
- selecting an option;
- interacting with a form;
- expanding an accordion;
- using an interactive component.
A page can load quickly and still feel frustrating if it does not respond promptly after interaction.
Why Is INP High?
A simplified interaction can be understood as:
User input → Input delay → Event processing → Rendering → Next paint
If the browser’s main thread is busy, the interaction may have to wait.
If an event handler performs too much work, processing takes longer.
If rendering after the interaction is expensive, visual feedback may also be delayed.
1. Find the Slow Interaction
“JavaScript is slow” is not a useful diagnosis.
Identify what users are actually doing when responsiveness deteriorates.
For example:
- opening the mobile menu;
- clicking Add to Cart;
- typing into search;
- changing a filter;
- submitting a form.
Then trace the work triggered by that interaction.
2. Reduce Long Main-Thread Tasks
Large tasks can prevent the browser from responding promptly.
Potential causes include:
- excessive JavaScript execution;
- heavy third-party scripts;
- inefficient event handlers;
- expensive DOM operations;
- large synchronous tasks.
Break unnecessary long work into smaller units where appropriate so the browser has opportunities to respond.
3. Remove Unnecessary JavaScript
Every script should justify its cost.
Audit:
- analytics scripts;
- advertising scripts;
- chat widgets;
- social widgets;
- sliders;
- tracking libraries;
- plugin scripts;
- unused frontend libraries.
A script can be useful and still be expensive.
The correct decision is not automatically “remove all third-party code.” Evaluate whether its business value justifies its performance cost.
4. Give Users Immediate Feedback
Some actions legitimately take time.
In those cases, immediate visual feedback can improve perceived responsiveness.
For example, a button may:
- change state;
- show progress;
- indicate loading;
- become temporarily disabled.
This does not replace performance optimization, but it prevents users from wondering whether their action registered.
INP Diagnostic Framework
| Check | Failure | Likely cause | Fix direction |
|---|---|---|---|
| Input delay | Action waits before processing | Busy main thread | Reduce/split work |
| Processing | Handler runs too long | Expensive JS | Simplify handler |
| Rendering | UI update is expensive | DOM/layout work | Reduce rendering cost |
| Third parties | Interaction competes with scripts | External JS | Audit/defer/remove |
The central question is:
What was the browser doing when the user needed it to respond?
How to Fix CLS
Cumulative Layout Shift measures unexpected visual movement.
Imagine trying to tap a button when an advertisement suddenly loads above it and moves the button downward.
That is not simply a speed issue.
It is a visual stability problem.
Common Causes of CLS
Typical sources include:
- images without reserved dimensions;
- ads without reserved space;
- embeds;
- dynamically inserted content;
- font swaps;
- banners;
- cookie notices;
- widgets;
- late-loading interface components.
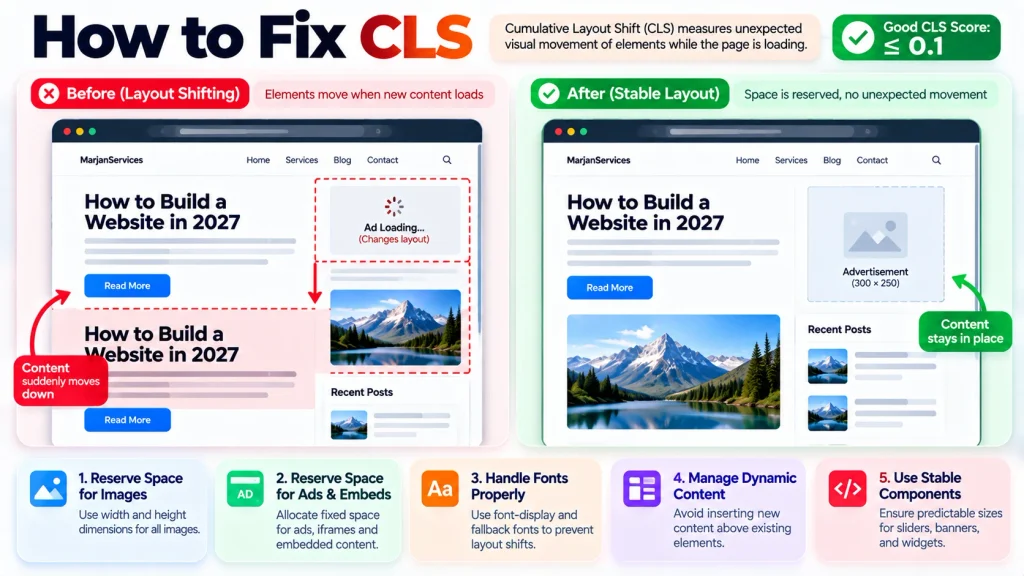
1. Reserve Space for Images
The browser should know the intended image dimensions before the image finishes loading.
Without reserved space, later image rendering may push existing content around.
2. Reserve Space for Ads and Embeds
Advertising and embedded content can vary in size.
Where practical, allocate appropriate space before those resources load.
3. Investigate Fonts
Web fonts can change text dimensions after initial rendering.
Review:
- fallback fonts;
- font loading strategy;
- font metrics;
- layout changes when the final font arrives.
4. Be Careful With Dynamically Inserted Content
Adding content above something the user is already reading can cause disruptive shifts.
Where possible, reserve space or place dynamic updates in locations that do not unexpectedly move existing content.
CLS Diagnostic Framework
Observe shift → Identify moving element → Find what changed its geometry → Reserve or stabilize space → Retest.
This is more effective than trying unrelated performance optimizations.
Why Does PageSpeed Look Good but Core Web Vitals Still Fail?
This is one of the most important troubleshooting questions.
A good diagnostic test does not necessarily mean all real users are having the same experience.
Possible reasons include:
Real Users Have Different Hardware
A modern desktop can execute JavaScript much faster than a low-powered mobile device.
Network Conditions Differ
Visitors may use:
- mobile networks;
- congested Wi-Fi;
- high-latency connections;
- distant geographic routes.
Real Users Interact Differently
A lab run may not reproduce the same interactions that cause poor INP for actual visitors.
Cache States Differ
A returning visitor with cached resources may experience the site differently from a first-time visitor.
Field Data Represents a Distribution
Core Web Vitals evaluation is not based on the fastest user or your personal test.
This leads to an important principle:
Use lab data to investigate problems. Use field data to determine whether real-user experience has improved.
Core Web Vitals Good on Desktop but Bad on Mobile
Mobile performance problems deserve separate investigation.
Possible reasons include:
- slower processors;
- constrained memory;
- slower connections;
- oversized images;
- excessive JavaScript;
- mobile-specific menus or components;
- different responsive layouts;
- mobile advertising behavior.
Do not simply assume mobile needs “more compression.”
Test the mobile experience as its own environment.
How to Improve Core Web Vitals in WordPress
WordPress itself does not automatically cause poor Core Web Vitals.
Performance depends on the complete stack:
Theme + Plugins + Hosting + Database + Media + Third-party scripts + Caching + CDN + Content architecture
Audit the Theme
Look for:
- excessive scripts;
- oversized stylesheets;
- unnecessary effects;
- heavy sliders;
- poorly optimized components.
Audit Plugins
Do not judge plugins solely by their number.
One inefficient plugin can create more performance work than several lightweight plugins.
Ask:
- Does it load assets on every page?
- Does the page need those assets?
- Does it add frontend JavaScript?
- Does it make expensive backend requests?
- Does it duplicate another plugin’s functionality?
Optimize Images
For image-heavy WordPress sites:
- use appropriately sized images;
- compress them;
- use efficient formats where suitable;
- provide responsive variants;
- lazy-load below-the-fold images;
- prioritize important above-the-fold media.
Use Caching Intelligently
Caching can reduce repeated processing and improve delivery.
But caching should be treated as part of the architecture, not as a magic button.
Evaluate Third-Party Services
Chat, analytics, ads, social embeds, tracking, and marketing tools can affect performance.
Measure their cost before and after implementation.
A Better Core Web Vitals Troubleshooting Framework
Instead of applying generic fixes, use this eight-part framework for each issue.
1. Check
Which metric is failing?
LCP, INP, or CLS?
2. Owner
Which layer likely owns the problem?
- hosting;
- backend;
- frontend;
- content;
- third-party service;
- advertising;
- WordPress plugin;
- theme.
3. How to Test
Choose a test that can reproduce or expose the suspected problem.
4. What Failure Looks Like
Define the failure before changing anything.
Examples:
- LCP element discovered too late;
- long interaction delay;
- image causes visible layout movement.
5. Severity
Determine whether the problem affects:
- one URL;
- one template;
- mobile users;
- desktop users;
- most of the site.
6. How to Fix
Apply the smallest targeted fix that addresses the identified cause.
7. Manual or Automated?
Some issues can be detected automatically.
Others require manual inspection or real-user evidence.
Do not assume an automated tool understands every aspect of the user experience.
8. Retest
Repeat the same diagnostic test and then monitor field data.
That closes the optimization loop.
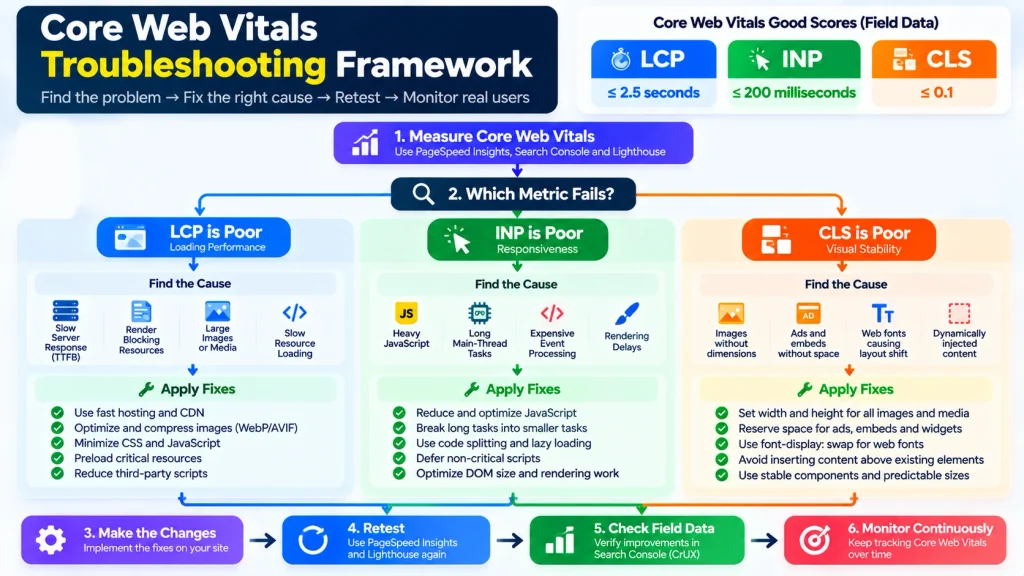
Core Web Vitals Decision Matrix
| Situation | First action | Avoid |
|---|---|---|
| Poor LCP | Identify LCP element and loading path | Random plugin installation |
| Poor INP | Identify slow interaction/main-thread work | Image compression as the only fix |
| Poor CLS | Identify shifting element | Generic caching changes |
| Good lab, poor field | Investigate real-user conditions | Declaring the problem solved |
| Mobile only | Test mobile-specific bottleneck | Assuming desktop results apply |
| One template affected | Inspect that template | Rebuilding entire site immediately |
| Site-wide issue | Inspect shared infrastructure/assets | Fixing URLs one by one |
Which Core Web Vital Should You Fix First?
There is no universal rule that LCP should always be fixed before INP or CLS.
Prioritize based on:
- which metric is failing;
- how many users or pages it affects;
- severity of the experience problem;
- business importance of affected pages;
- feasibility and impact of the fix.
If a severe layout shift causes users to click the wrong control on a checkout page, that may deserve immediate attention even if another page has a modest LCP problem.
Prioritization should reflect user impact, not simply the order in which metrics appear in a report.
Common Core Web Vitals Optimization Mistakes
Chasing a Perfect Score
A perfect synthetic score is not the same thing as perfect real-world performance.
Use scores as diagnostic signals, not trophies.
Installing Multiple Optimization Plugins
Overlapping performance plugins can create complexity, conflicts, duplicate optimization, or unexpected behavior.
Understand the problem before adding another tool.
Optimizing Everything at Once
If you make ten changes simultaneously, you may not know which one helped or caused a regression.
Make controlled changes when practical.
Ignoring Real Users
A lab test can help diagnose a problem but cannot represent every device, connection, and interaction.
Compressing Every Image Aggressively
Performance matters, but so does visual quality.
Use sensible compression rather than destroying useful imagery.
Delaying Critical Content
Lazy loading and deferral are valuable techniques when applied to the right resources.
Applying them indiscriminately can delay content users need immediately.
Removing Functionality Without Measuring Business Impact
A chat widget may have performance cost.
It may also generate valuable leads.
Measure both technical cost and business value.
Performance optimization is a product decision as well as a technical one.
Core Web Vitals Optimization Checklist
Before declaring the work complete, verify:
- LCP has been measured.
- INP has been evaluated using appropriate field evidence where available.
- CLS has been measured.
- Mobile and desktop have been considered separately.
- Field and lab data have not been confused.
- The actual LCP element has been identified.
- Critical images are properly sized and delivered.
- Important above-the-fold resources are not unnecessarily delayed.
- Server response has been reviewed.
- Render-blocking work has been investigated.
- Long JavaScript tasks have been reviewed.
- Third-party scripts have been audited.
- Important interactions have been tested.
- Image dimensions are reserved.
- Ads and embeds have appropriate space where possible.
- Font-related layout shifts have been investigated.
- WordPress themes and plugins have been reviewed where applicable.
- Changes have been retested.
- Real-user data will be monitored after deployment.
How Long Does It Take for Core Web Vitals to Improve?
There are two separate questions:
How quickly can the technical problem improve?
Potentially as soon as a successful fix is deployed.
How quickly will field-data reporting reflect the improvement?
Not necessarily immediately.
Real-user datasets aggregate observations over time. That means a technically successful change may appear in lab testing before aggregated field reporting fully reflects it.
Do not undo a correct fix simply because historical field data has not changed immediately.
Do Core Web Vitals Affect SEO?
Core Web Vitals are part of the broader page-experience picture, but they should not be treated as a standalone ranking formula.
A faster, more stable, more responsive site is valuable primarily because it improves user experience.
Performance optimization should therefore complement:
- useful content;
- search-intent satisfaction;
- crawlability;
- indexability;
- internal architecture;
- mobile usability;
- security;
- accessibility;
- overall site quality.
Do not sacrifice useful content merely to achieve a prettier performance report.
Frequently Asked Questions
What is a good Core Web Vitals score?
The current good thresholds are generally LCP of 2.5 seconds or less, INP of 200 milliseconds or less, and CLS of 0.1 or less, evaluated at the 75th percentile.
What are the three Core Web Vitals?
They are Largest Contentful Paint (LCP), Interaction to Next Paint (INP), and Cumulative Layout Shift (CLS).
How can I check Core Web Vitals?
Use real-user field data where available and diagnostic tools such as PageSpeed Insights and browser performance tooling to investigate individual issues.
Why are my Core Web Vitals failing?
Common causes include slow content loading, server delays, inefficient resource delivery, excessive JavaScript, slow interactions, unstable layouts, third-party scripts, images, fonts, embeds, and dynamic content. The exact cause depends on which metric is failing.
Why is my PageSpeed score good but Core Web Vitals fail?
A synthetic test represents controlled conditions, while field data represents actual users across different devices, networks, and interactions. Good lab results therefore do not automatically mean all real users receive the same experience.
Can a WordPress plugin fix Core Web Vitals?
A plugin may help with a specific bottleneck such as caching, image optimization, or resource delivery, but no single plugin can reliably fix every LCP, INP, and CLS problem. Diagnosis should come before tool selection.
Is LCP the same as website speed?
No. LCP measures a specific part of loading performance: when the largest relevant visible content element is rendered. Website performance is a broader concept.
Does image compression improve INP?
Usually not directly. INP focuses on interaction responsiveness. Excessive main-thread work, JavaScript, and interaction processing are more likely areas to investigate.
How do I fix CLS?
Identify which element shifts unexpectedly, determine why its dimensions or position change, reserve appropriate space or stabilize its rendering, and retest.
Should I optimize mobile and desktop separately?
Yes. Devices, processors, connections, and responsive layouts can differ substantially, so a problem visible on mobile may not appear on desktop.
Final Takeaway
Improving Core Web Vitals is not about chasing a perfect number.
It is a diagnostic process.
Start with the user experience:
What is slow, unresponsive, or unstable?
Then identify the responsible metric:
LCP, INP, or CLS?
Then locate the earliest layer where the problem appears:
Server, resource loading, JavaScript, rendering, layout, third-party code, theme, plugin, or content?
Fix that cause, retest it, and use real-user evidence to determine whether the improvement reaches actual visitors.
The most useful Core Web Vitals workflow is therefore:
Measure → Diagnose → Prioritize → Fix → Retest → Validate → Monitor.
That approach produces something more valuable than a temporary green score: a website that loads important content sooner, responds more quickly to users, and remains visually stable while they use it.
Recommended Technical SEO & Website Performance Guides
- Technical SEO Guide
- Technical SEO Services
- Website Maintenance Guide
- Website Maintenance Services
- Website Development Services
Official Core Web Vitals & Performance Resources